Geographic Information System for Crime Prevention
In 1998, Vacaville, California, USA, had a string of eight robberies. The robber came to be labelled as Bandanna Bandit. The police were clueless. Crime Analyst Laura Bettencourt took to Geographic Information System (GIS) to identify the likely future targets and the days of his next hits. Based on which police set up surveillance on possible future targets. Soon, the suspect was found entering a predicted location and attempting to hold it up. The deputies intervened, a gun battle ensued, and the suspect was killed. Likewise, in 1999, a felon after being arrested and convicted filed a lawsuit against the City of Shawnee, Kansas, the USA is contending that the police had used unreasonable force while making the arrest. A map made in GIS to defend the arresting officer’s testimony revealed that the suspect had darted at high speeds through residential areas, bypassing several red lights and had jumped out of his car in a densely populated housing project to elude the police. The culprit was deemed as posing a great danger to public safety. Hence the officer was exonerated from the case.
 We have come across Crime thrillers and movies where criminals outsmart the police by a mix of deception and hoax. Throughout history, there has been a cat-and-mouse contest between criminals and the police. One of the concrete ways of ensuring that a criminal doesn’t con the police is by the deployment of GIS and other spatial technologies in crime investigation, for detection and tracking that. Are making police organisations more efficient and effective in nipping criminality in the bud.
A Geographic Information System (GIS) is a system developed to capture, stock, manipulate, analyse, manage, and present spatial or geographic data. GIS applications are instruments that permit users to create interactive queries, analyse spatial data, edit data in maps, and present the outcomes of all such activities.
We are today witnessing an increasing role of GIS in law enforcement and police force planning and deployment, in particular, because of the heightened prerogative of crime theory to focus on place instead of people. The concentration of crime in limited areas is astonishing and naturally invites place-based policing. For example in the USA, 3% of the city’s addresses accounted for 50% of calls for service to the police in Minneapolis and about 4% of streets and intersection areas generated nearly 50% of the city’s narcotics arrests and almost 42% of the disorder arrests in Jersey City, New Jersey.
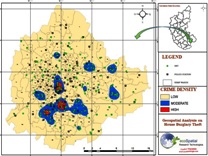
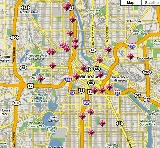 Police agencies are using Geographic Information Systems (GIS) for mapping crime, identifying crime “hot spots,” assigning officers, and profiling offenders, but little research has been done about the effectiveness of the technology in policing organisations. Hot-spot policing plans and adjusts the deployment of a police force under the geographic variation of crime and focuses police patrol on crime hot spots. A standard definition of a hot spot is an area with a higher than the average number of criminal or disorder events.
It is seen that the implementation of a GIS is frequently steered by jurisdictional, objective, or application prerequisites. Generally, a GIS execution may be custom made for an establishment. Thus, a GIS formulated for an agency may not be inevitably interoperable or compatible with a GIS that has been evolved for some other application, management, industry, or use.
GIS delivers every type of location-based organisation, a setting to update geographical data without having to waste time to visit a place or location and update a database manually. GIS, when integrated with other robust enterprise solutions like SAP and the Wolfram Language, helps build a powerful decision support system at the enterprise level, enabling domains to benefit from GIS technology. A competitive GIS market has resulted in lower prices and perpetual refinements in the hardware and software components of GIS, and usage in different fields, including crime mapping. GIS is also spreading out into location-based services, which enables GPS-enabled mobile devices to indicate their location with regards to fixed objects such as a restaurant, a gas station, or migrating objects such as friends, children, police car, or to transmit their location back to a central server for display or other processing.
 According to a 2001 survey by the National Institute of Justice in the USA, 62 percent of police departments with over 100 officers use GIS systems. On the whole, the technology has helped in decreasing crime, reducing residential burglaries, tracking parolees and habitual severe offenders, and identification of “hot spots” with high concentrations of crime.
GIS has four major uses in policing. Crime mapping identifies the geographical distribution of crime to deploy officers to “hot spots” of activity and to develop other intervention plans.
Many departments have developed computerised statistics or CompStat systems to help manage the decision-making process. The system supports instant crime analysis, deployment strategies, active enforcement, monitoring of emerging patterns, and responsibility programs for law enforcement commanders.
GIS also is used to build geographical profiling of criminals, an investigative technique that enables police to identify locations of related crimes to help deduce where a criminal may live, especially in serial cases.
While these practices are widespread, especially in larger departments, little research is available to measure their effectiveness in policing. Current studies indicate that GIS is used mainly to aid in the design of policing strategies and to evaluate the decision-making processes at law enforcement agencies.
Police can better understand the underlying causes of crime and help police formulate strategies to tackle crime by overlaying other datasets such as locations of bars, location of evil characters, rowdies, site of colleges etc. GIS is also useful for deploying police personnel and other resources. We can put an explicit strategy to lessen crime in place, but for that, we would have to know the location of the assets to transfer them to where we might require them. We would also have to know the developments taking place if any.
There are several theories which explain the spatial behaviour of criminals such as routine activity theory, developed by Lawrence Cohen and Marcus Felson, rational choice theory, developed by Ronald V. Clarke and Derek Cornish, and environmental criminology. In recent years, crime mapping and analysis have incorporated spatial data analysis techniques. Spatial data analysis helps one analyse crime data and better understand why and not just where crime is occurring. From a research and policy perspective, crime mapping is used to understand patterns of incarceration and recidivism, help target resources and programs, evaluate crime prevention or crime reduction programs. The boom of internet technologies, particularly web-based geographic information system (GIS) technologies, is opening new opportunities for the use of crime mapping to support crime prevention
In the days to come, we may use GIS and artificial intelligence for all forms of policing. As technology becomes more active and sophisticated, more and more police organisations will resort to this technology. Analysis of social media posts and location tracking is a standard method used by law enforcement agencies to take pre-emptive actions. Even for tracing terror suspects or criminals, location tracking of their social media or phone records often comes handy.
Mapping crime, using Geographic Information Systems (GIS), enables crime analysts to identify crime hot spots, along with other trends and patterns.
Crime mapping is being employed by police to map, visualise, and analyse crime occurrence patterns. It is a crucial ingredient of crime analysis and the CompStat policing strategy.
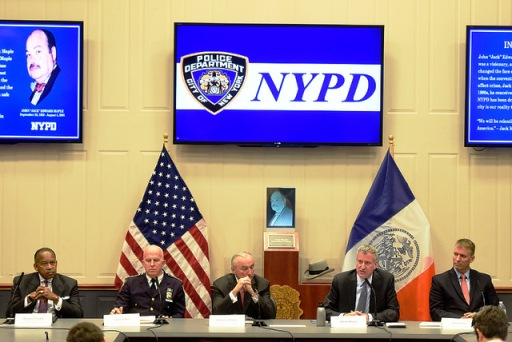
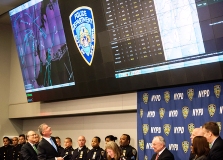
In India, for several years we have been deploying a rudimentary system of crime mapping at the police station level by way of Part 2 Crime Charts. Commissioner of the NYPD (New York Police Department) the ever flamboyant, Bill Bratton in his first tenure in 1994 introduced Crime CompStat (which stands for COMPare STATistics) a unique strategy that helped bring down crime drastically. It reaped the power of GIS for furnishing real-time insights and situational awareness that changed policing in New York forever.
CompStat was initiated under the guidance of Jack Maple when he was a transit police officer in New York City. The strategy was initially christened ”Charts of the Future”. The procedure envisaged tracking of crimes by sticking pins in maps. The simple strategy. of ”Charts of the Future” brought down subway crime by 27 percent.
William J. Bratton, Chief of New York City Transit Police was later appointed police commissioner by Rudolph Giuliani, the Mayor of New York, and he brought Maple’s Charts of the Future with him. After overcoming some initial opposition, he made the NYPD adopt it and renamed it as CompStat. Compstat method started yielding results, and it curtailed crime by 60%. In 1993, before the NYPD (New York Police Department) embraced CompStat, there were around 2,000 cases of murders in the city. In just one year following its adoption, the number of murders started dropping rapidly; it fell to 1181 from 1995. By 2003, the number of murders had declined to 596 murders; it fell further to 352 by 2015 the lowest since 1964.
Compstat wasn’t a computer system but a statistical tool that processed crime events and arrests reports to arrive at the hotspots of crime in the city. To better describe it, it was simply an improved version of crime charts maintained since last century in the police stations of Tamilnadu, where the crimes and accidents would get reflected in a map. A cluster of crimes or accidents in a close vicinity meant that the particular area deserved frequent beats.
GIS plays a significant role in bolstering law enforcement and is being widely used by police organisations across the world. CompStat hinges on real-time data sharing, the immediate deployment of resources, as well as on planning powerful strategies with constant feedback and appropriate follow-up action.CompStat uses GIS as an interactive working platform to bring real-time awareness to emerging crime trends. Los Angeles and Baltimore, like several other cities, have witnessed a reduction in crimes by integrating CompStat in their workflows with CompStat rigidly following its leads.
Compstat offers an excellent strategy to reduce crime, improve quality of life, and manage resources personnel and resources. Compstat enables police officers to recognise surging trends in crime through comparative statistics and aids them to deal with the spikes in crimes through the practice of targeted enforcement. The Compstat has four commonly recognised components: it provides reliable and precise information or intelligence, leading to immediate deployment of resources, effective tactics, and constant follow-up. We can modify or broaden Compstat to meet the specific requirements of different wings of the police organisations. Initially, it was based on the broken windows theory, according to which proper handling of minor crimes satisfactorily would also result in a reduction in major and other crimes.
Nonetheless, with time, its use appears to have degenerated into a system of assessing an officers competence, and for making officers liable for upswings in criminal incidents. Now, several companies have begun developing Compstat turnkey packages containing computer systems, software, and other tools. Geographic Information Systems are allowing organisations to map crime or various types of data, to help them know and solve issues in their designated area.
Everything we deal with in law enforcement has a location attached to it: the site of a crime, the place where the offender lives or works, the area where evidence is collected, etc. The places where we live are also imbued with spiritual energy, but we have been dishonouring nature. The ancient civilisations worshipped nature. When there is a sense of reverence towards the planet we live on, we cannot pollute it or harm it. This attitude of honouring nature is what we must bring back through education and understanding.
Source from: epaper/deccanchronicle/chennai/dt:16.12.2019
 Dr.K. Jayanth Murali is an IPS Officer belonging to 1991 batch. He is borne on Tamil Nadu cadre. He lives with his family in Chennai, India. He is currently serving the Government of Tamil Nadu as Additional Director General of Police, Law and Order.